Microsoft Power BI –What is it and how does it work?
26 August 2024
Reading time: 8 minutes

With Microsoft Power BI you are able to optimize your business decisions and create intuitive reports. Find out what exactly Power BI is, what functionalities this tool offers and what you can gain by implementing this solution in your company.
What is Power BI?
Power BI is a Microsoft program in the Business Intelligence class. The tool allows you to analyze data from various sources and design high-quality reports, visualizations and interactive analysis. MicrosoftXD Power BI is a part of the Power Plaform family and makes sure that the reports presented are always up-to-date. Power BI allows you to share collected data in real time, which supports the reporting process and significantly reduces its time, thus enabling faster business decisions based on the latest information, instead of relying on outdated data.
Power BI features and functions
Microsoft Power Bi is a complex tool that provides companies with many options to make even better business decisions in less time. Here are some of them:

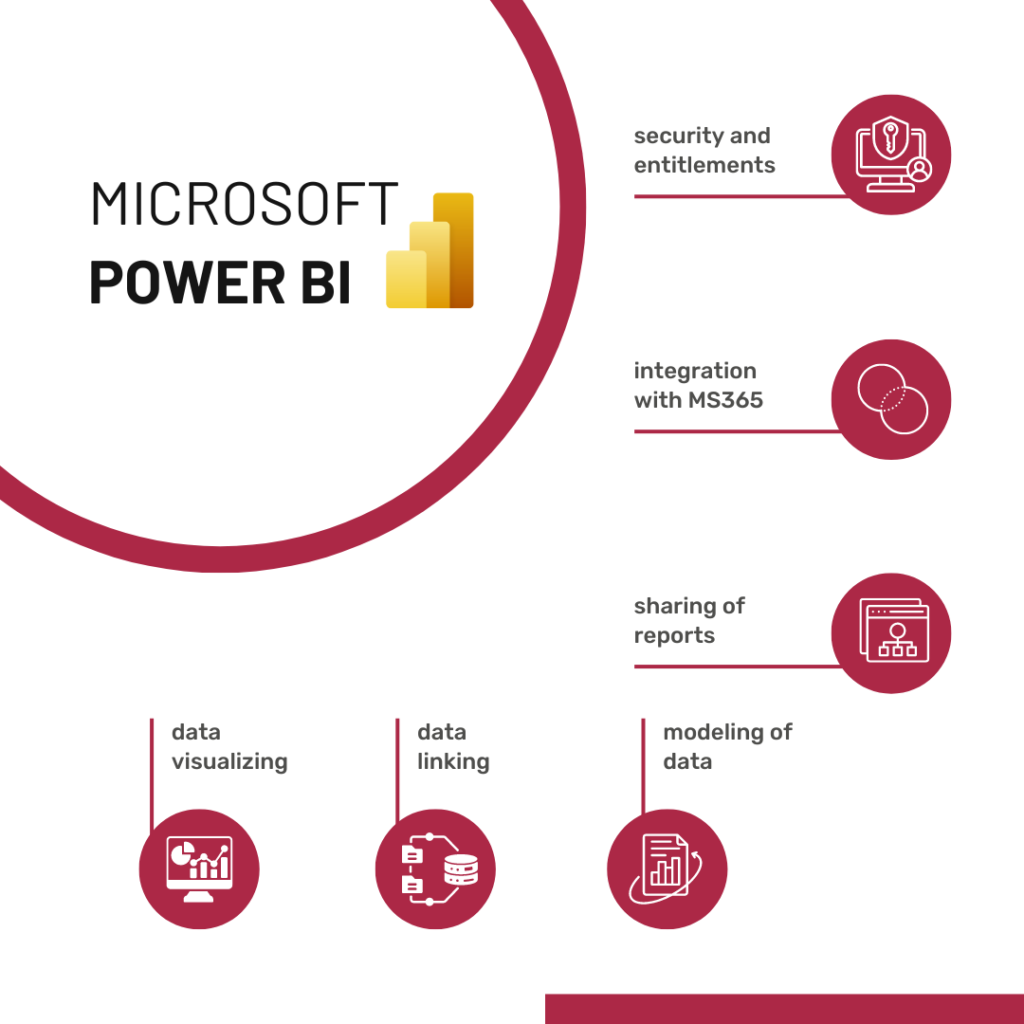
- DATA VISUALING – Power BI allows you to create a variety of tables, charts, maps and other types of reports based on your collected data. You can decide for yourself what your BI reports will look like so that the communication of information is clear and attractive.
- DATA LINKING – with this feature you are able to combine any data collected from different sources. Before Power BI moves on to visualization, it gives you the ability to transform and model data collected from, e.g.: Excel, a website or an online service.
- DATA MODELING – creating a data model in Power BI allows you to define relations between tables, add calculations and measures, and create hierarchies. As a result, we are able to obtain accurate and consistent results.
- SHARING OF REPORTS – Power BI reporting is very intuitive with the ability to publish your reports on the Power BI Service platform. Other users can easily explore them interactively. There is also
a function for sharing finished visualizations in the form of elements on websites. - SECURITY AND AUTHORIZATION – Microsoft Power BI allows you to freely manage access at multiple levels. Control who can edit and see your reports to ensure the security of the data shared.
How does Power BI work?
Microsoft Power Bi combines business analytics, data visualization and best practices, as confirmed by Gartner in its 2023 “Magic Quadrant for Analytics and Business Intelligence Platforms” report. Power Bi converts data from multiple sources to create interactive dashboards and Business Itelligence reports.
The service is based on the Azure platform, so Power BI reporting always undergoes in real-time.
Overview of the Power BI workflow: data collection, model creation, visualization and report publishing
To work effectively in Microsoft Power BI, you need to connect to your data by importing it from various sources. Once they’re imported, use Power Query to clean and transform them so they’re ready for analysis. Then, you can create visualizations, using different types of charts and graphics to present the data in an attractive way. Finally, publish your reports to the Power BI service so colleagues can view and analyze them for effective decision-making.
The use of Power BI
We can mainly use Microsoft Power BI to create reports from many sources, including:
- databases
- CSV files
- Microsoft Excel
- websites
- mobile applications
Examples of Power BI use
Microsoft Power BI can be used in many areas, making it widely used by companies from various industries around the world. Examples include:
👉 Financial reporting:
Companies often use Microsoft Power BI to analyze financial performance, forecast revenue and manage costs.
👉 Analysis of sales data:
Power BI allows you to create dynamic reports that are extremely useful in analyzing sales data. With this tool we can:
- Explore data: Review and thoroughly analyze sales data to learn what factors are affecting current performance.
- Track trends: Observe changes over time and respond accordingly.
- Identify key performance indicators (KPIs): Create indicators such as conversion indicator, average transaction value or customer retention indicator.
In addition, BI reporting can be used to create reports on any advanced analysis and anomaly detection.
Benefits and challenges of implementing Power BI solutions
Like most tools on the market, Power BI has its supporters, as well as those who may be skeptical of the tool or have concerns about implementing it in their company. Let’s take a closer look at the benefits and challenges of its implementation.
Benefits:
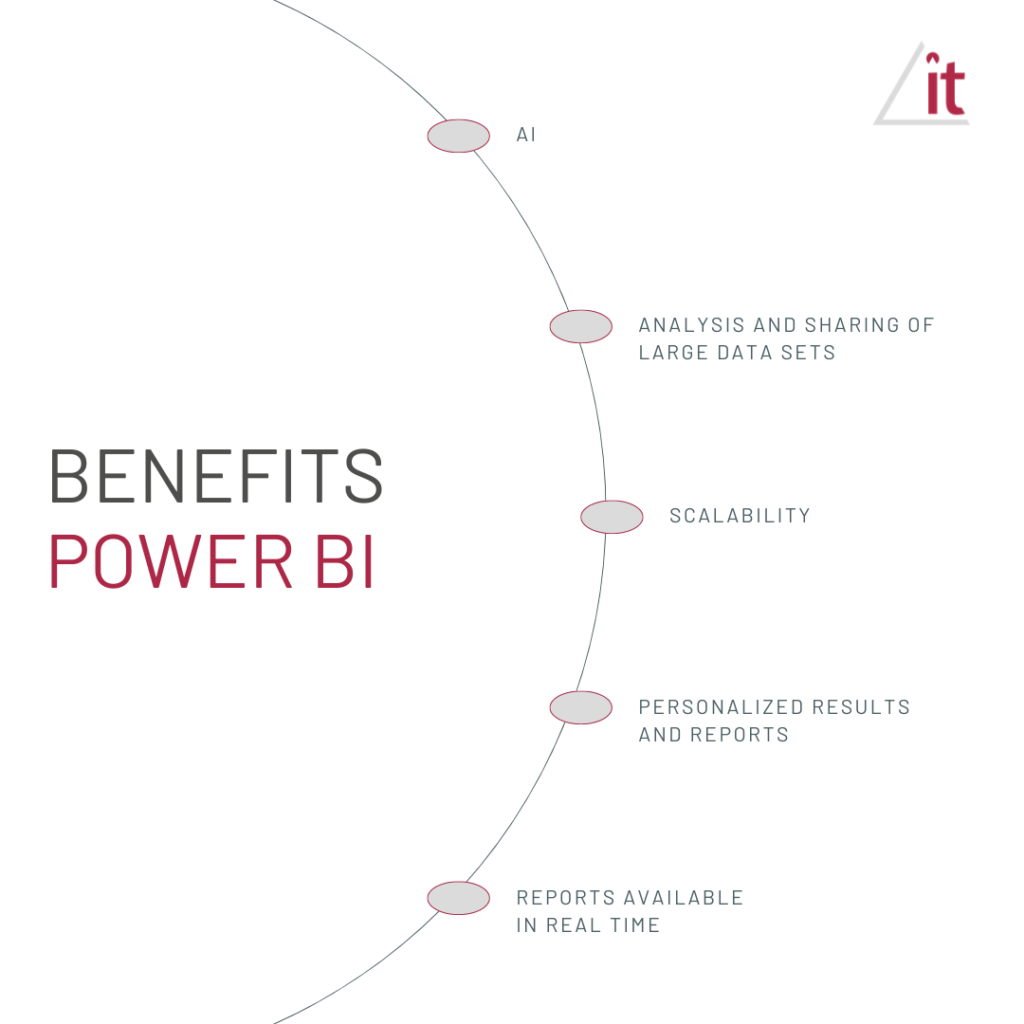
- Based on AI – Power BI provides access to, among others, image recognition and text analysis, which allows people without technical skills to efficiently prepare and analyze data.
- By combining Power BI with Azure, large data sets can be managed efficiently, reducing the time to obtain applications.
- You can easily create personalized views and reports to meet any organization’s needs.
- Seamless integration of Power BI with other Microsoft solutions, such as Excel files and Azure cloud.
- It allows you to always be up to date with frequent updates and new functionalities in BI reporting.
- Thanks to its scalability, Power Bi can serve both small and large companies.

Challenges:
- Large data sets can slow down the report performance. Query and data model optimization is key here.
- Choosing the right visualizations and configuring them can be a challenge. Keep in mind that reports should be clear and intuitive for users.
How to get started with Power BI
Given that Power BI has several versions (Power BI Desktop, Power BI Pro and Power BI Premium), you need to consider which one will be right for your organization.
Power BI Desktop is a free version that will allow you to learn about the functionality of the service and see the look of the interface and the entire Power BI work environment. BI services are designed for companies of all sizes, when Excel or another similar program is no longer sufficient in their daily work. Larger organizations are more likely to use paid licenses of the program, gaining access to more advanced features. Before you decide to buy a license and implement Power BI, it’s worth testing its free version. The paid version offers features such as dashboard sharing, automatic data refreshing and data visibility control. Although these options are not available in the free version, you can use it to connect to data files and create effective dashboards for your own purposes.
A guide to setting up an account in Power BI
We already know what Power BI is and what features it has. Now let’s look at what needs to be done to start using it.
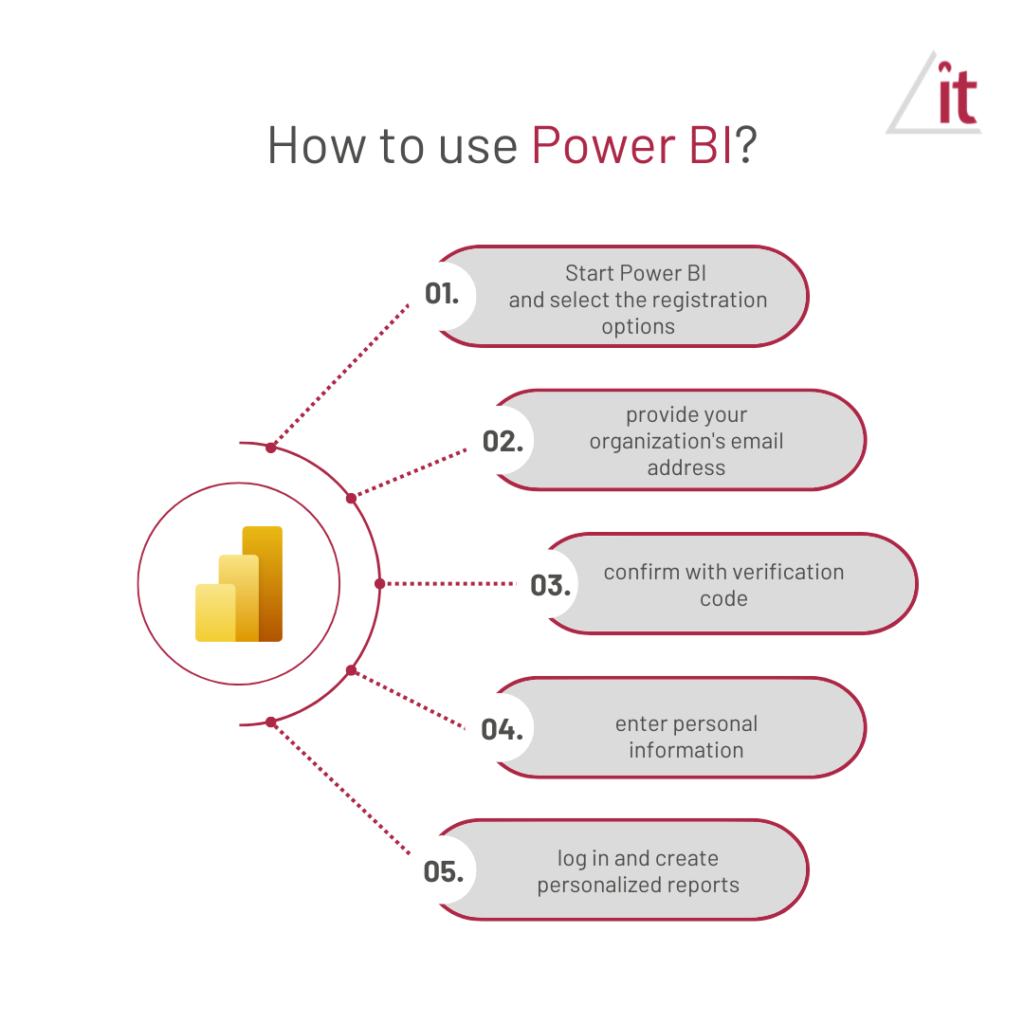
1. Launch the Power BI website.
2. Select the registration option by clicking on the “Start Free” or “Register” button on the home page.
3. Enter your email address, knowing that Power BI requires an address with a company domain, which excludes the use of addresses such as gmail.
4. You will receive an email with a verification code to enter on the registration page.
5. Enter your personal information.
6. Once registration is complete, log in to your new account using the email address and password you provided.
7. Start using Power BI – you can start creating reports, visualizations and analyzing data.

summ-it is able to comprehensively support you in implementing and smoothly navigating Power BI – we offer an end-to-end service and a proprietary audit of the tool. Not only do we implement the Microsoft Power BI tool, but we also offer services related to the support of analytics and data management tools. As part of the implementations, summ-it clients can order not only the launch of reports, but also their maintenance and development. summ-it specialists provide reporting support in a 365/7/24 model with guaranteed response time in the SLA. We have implemented Power BI in financial institutions, FMCG corporations, large service companies and logistics centers, among others. We have experience with companies located around the world, for example, we have implemented Power BI solutions for D-Marin , a leader in marina management and development. By implementing systems in the field of analytics and data management, we provide the highest quality services and guarantee security, as evidenced by the ISO 27001 and ISO 9001 certifications we have obtained.
Summary
Microsoft Power BI is not only a data analysis tool, but also a key component of business strategy that enables companies to make better data-driven decisions. With advanced integration features, interactive visualizations and automation capabilities, Power BI supports organizations in optimizing processes and increasing operational efficiency. In an era of digitization and increasing competition, the ability to use information effectively is becoming a significant asset, and Power BI is a tool that can help with this.
FAQ
What are the benefits of Power BI?
Power BI enables companies to transform raw data into valuable business information through advanced visualizations and interactive reports to support better decision-making. In addition, integration with various data sources and process automation increase operational efficiency and save time.
How is Power BI different from other business tools?
Microsoft Power BI is distinguished by its advanced data visualization capabilities and broad compatibility with various data sources, allowing centralization and comprehensive data analysis in one place.
In which industries will Power BI reports be useful?
Power BI can be used virtually in any company in any industry. The tool is commonly used in areas such as finance, marketing, sales or manufacturing to analyze data, monitor key performance indicators and support business decisions.
How to get started with Power BI?
To get started with Microsoft Power BI, download and install Power BI Desktop, then connect to data from various sources, such as Excel or SQL Server. Then create visualizations and publish reports to the Power BI service to share with others.
If you’d like to learn more how Power BI can help your business grow, contact us today!
Sources
- What is Power Bi? – SkuteczneRaporty.pl
- Monitoring Report Usage Metrics – Power BI | Microsoft Learn
- Top 20 Benefits of Power BI you Should Know in 2024 (knowledgehut.com)
- Course POWER w Power BI #1 – How to create an account w Power BI service (youtube.com)
- Microsoft Power BI at the top of the report Gartner Magic Quadrant! (integritypartners.pl)
- Power BI Desktop – how to get started with the tool | NewDataLabS
- How to start using Power BI? | Power BI


